Short Track: Deepest Supercross Field -- is it 2016?
3/17/2016
Based on a twitter question from Bob (@bobfromomaha) wondering "What is the deepest field in history?", we're going to look and see what kind of numbers are out there that might provide some context, at least in terms of Supercross.
@pulpmx @imtravismarx "What is the deepest field in history?" would be a cool data related question to answer
— Bob (@bobfromomaha) March 16, 2016
I'll maintain as I did in the twitter conversation that the first step is to define what a "deep field" is. In this case, we have to restrict the definition to something we can evaluate quantitatively. As @TheSmed13 pointed out, it can be a mistake to try to quantify a qualitative variable, such as "deep" in this case, but I would counter that putting quantitative elements into the discussion can provide important information, though it won't solve the question -- nor would anyone say that they think the numbers can provide a hard and fast solution.
So, with that said, I'm going to reframe the problem to ask "How many riders entered each season who had previously won a Supercross race in the top class?" (I'm using the term "Upper" to denote the top class, i.e. 450 or 250, whichever was the bigger bike class at the time). This is along the lines of what @imtravismarx was suggesting in the twitter conversation, and I think that's a pretty basic criterion for a quality rider -- has he ever won a Supercross race? And we can also add in "has he at least finished 2nd or 3rd?" If someone has won a Supercross race in their career, I think they qualify as a contributor toward making the field "deep". If they haven't, and/or if they've never even made a podium, then forget about them in terms of the quality at the top of the field.
This reframed question still has at least two big problems. First, if one rider is consistently winning all the races in one season (or more), then it makes the other riders look worse in terms of finishing position, even if they are riding faster compared to riders in other seasons. Second, it doesn't take into account rookies in the Upper class, who may be contributing to the overall competition, such as Marvin Musquin is doing in 2016. It also doesn't take into account the age of the riders, and just because someone placed 1st/2nd/3rd at some point in their career, say, 6 season ago, that doesn't mean they are necessarily providing competition in the current season. While I think that there may be a way to get around both of these problems by looking at lap times (which I'll discuss below), since the lap times only go back to 2003, we'll focus on this relatively simple analysis for now.
Enough with the talking already, you say, let's get to the graph! Each bar represents how many riders (in the Upper class Main Events) entered the season with their best career finish having being 1st, 2nd, or 3rd:
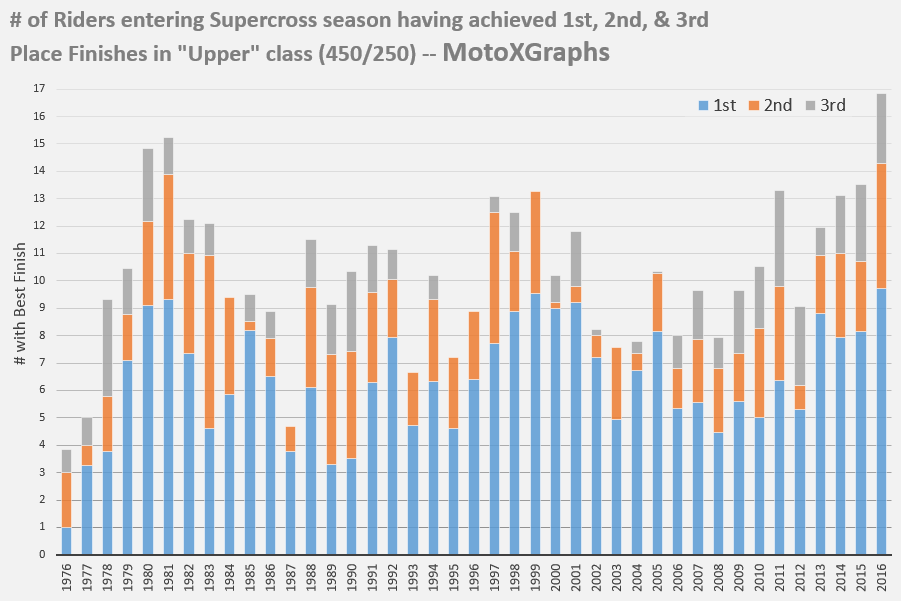
For instance, if the rider in the 2000 season had won a race prior to that season, he'd be included in the blue bar for year 2000, which has 9 total riders per race. If the rider's best finish prior to 2000 was 2nd place, then he'd be in the 2000 orange bar, where there was just one person, and if the best finish was 3rd, he'd be in the grey bar. The graph also takes into account injuries during the season, if the field thinned out due to injury (or got better because riders returned from injury). So in 2016, the blue bar shows 9.7 (not an even number because riders have come in and out (a la James Stewart or Justin Barcia), which means that the 10 races so far have had an average of 9.7 riders (entering the Main Event) who had won a Supercross race prior to 2016.
The 2016 season has the highest number, historically, for number of 1st place riders, just higher than 1999 (9.5), 2001 (9.2), and 2000 (9.0) -- 30+ years ago, 1981 had 9.3 and 1980 had 9.1. 2016 also has by far the highest number of riders who haven't won a race in their career but have finished 2nd and riders who have finished 3rd (such as Jason Anderson, Blake Baggett, and Justin Brayton).
Because the criteria aren't perfect, you could argue that 2013, 2014, and 2015 are pretty close to 2016, and maybe if we weren't using such a broad measure, they might even look more competitive top-to-bottom than 2016. That's where I think the lap times could help with the comparison, to get a little more detailed. I'm not quite ready for that yet, because I think the most important part is establishing a baseline. Some measurement that is more or less the same from year to year. One possibility is the average laptime (race by race) of all 22 Main Event riders, but that would still fluctuate up and down with the quality of the field overall. Another possibility is to use the average of the bottom half of the field, or perhaps the bottom 5 riders, since I would guess that stays pretty constant from year to year (although not entirely).
Once a baseline is established, then you can look at how fast the top of the class was compared to that baseline, and at least get a sense for whether the top 10 or 15 riders were close to the baseline or were much better than it in any given season.
Regardless, I think the above graph gives a lot of firepower to those who want to say that the 2016 field is one of the deepest of all time. And also that for the top group of riders, the last four or so years have been as competitive as any season since the late '90s. Here's the same information in a table, sorted by most 1st place riders:
| Year | 1st | 2nd | 3rd | Total |
|---|---|---|---|---|
| 2016 | 9.7 | 4.6 | 2.6 | 16.9 |
| 1999 | 9.5 | 3.7 | 0.0 | 13.3 |
| 1981 | 9.3 | 4.6 | 1.3 | 15.2 |
| 2001 | 9.2 | 0.6 | 2.0 | 11.8 |
| 1980 | 9.1 | 3.1 | 2.6 | 14.8 |
| 2000 | 9.0 | 0.2 | 1.0 | 10.2 |
| 1998 | 8.9 | 2.2 | 1.4 | 12.5 |
| 2013 | 8.8 | 2.1 | 1.0 | 11.9 |
| 1985 | 8.2 | 0.3 | 1.0 | 9.5 |
| 2005 | 8.1 | 2.1 | 0.1 | 10.4 |
| 2015 | 8.1 | 2.6 | 2.8 | 13.5 |
| 1992 | 7.9 | 2.1 | 1.1 | 11.1 |
| 2014 | 7.9 | 3.1 | 2.1 | 13.1 |
| 1997 | 7.7 | 4.8 | 0.6 | 13.1 |
| 1982 | 7.3 | 3.7 | 1.2 | 12.2 |
| 2002 | 7.2 | 0.8 | 0.2 | 8.2 |
| 1979 | 7.1 | 1.7 | 1.7 | 10.4 |
| 2004 | 6.7 | 0.6 | 0.4 | 7.8 |
| 1986 | 6.5 | 1.4 | 1.0 | 8.9 |
| 1996 | 6.4 | 2.5 | 0.0 | 8.9 |
| 2011 | 6.4 | 3.4 | 3.5 | 13.3 |
| 1994 | 6.3 | 3.0 | 0.9 | 10.2 |
| 1991 | 6.3 | 3.3 | 1.7 | 11.3 |
| 1988 | 6.1 | 3.6 | 1.8 | 11.5 |
| 1984 | 5.9 | 3.5 | 0.0 | 9.4 |
| 2009 | 5.6 | 1.7 | 2.3 | 9.7 |
| 2007 | 5.6 | 2.3 | 1.8 | 9.6 |
| 2006 | 5.4 | 1.4 | 1.2 | 8.0 |
| 2012 | 5.3 | 0.9 | 2.9 | 9.1 |
| 2010 | 5.0 | 3.3 | 2.3 | 10.5 |
| 2003 | 4.9 | 2.6 | 0.0 | 7.6 |
| 1993 | 4.7 | 1.9 | 0.0 | 6.7 |
| 1983 | 4.6 | 6.3 | 1.2 | 12.1 |
| 1995 | 4.6 | 2.6 | 0.0 | 7.2 |
| 2008 | 4.5 | 2.3 | 1.1 | 7.9 |
| 1978 | 3.8 | 2.0 | 3.6 | 9.3 |
| 1987 | 3.8 | 0.9 | 0.0 | 4.7 |
| 1990 | 3.5 | 3.9 | 2.9 | 10.4 |
| 1989 | 3.3 | 4.0 | 1.8 | 9.2 |
| 1977 | 3.3 | 0.8 | 1.0 | 5.0 |
| 1976 | 1.0 | 2.0 | 0.8 | 3.8 |
Posted by: SagehenMacGyver47 ::: As always – Feedback welcomed
Previous: Update On Passing Index | Back to Blog | Next: Toronto "This-Week" Predictions Review