Motocross Aging Curves
Aging curves are a big part of how we evaluate rider performance and make predictions of future outcomes. The concept is pretty straightforward - young athletes improve (in general) as they get older, until, naturally, age takes its toll and perfomance starts to decline with age. The results are below, and an in-depth description is below the graph area.
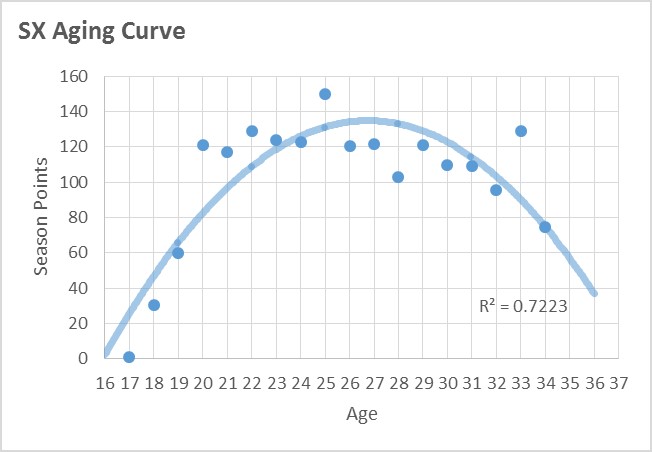
I'm going to insert this Supercross aging curve here, to keep it above the very tl;dr section below about what's behind the creation of the aging curve. The peak average performance was at age 26.75, which is a full year younger than MX - discussed below. SX data is limited compared to MX, and you can see that the curve does not fit as well. Se la vi - maybe more SX data will improve the chart over time.
Let's get the inputs out of the way - Average Yearly % Overall is described more fully in What?, but in short it is a method to compare all riders of all ages across all classes and all qualifier levels. You would expect that, in general, as riders get older, their % Overall would follow a more-or-less parabolic curve, and it does. Age is simple, on the surface, in that it's the age of the rider during the season of the race (some error is introduced b/c we don't always have exact birthdays and some birthdays are during the season). The number of riders that competed at each age is represented by the size of the circle (hover over to see how many riders are at each data point).
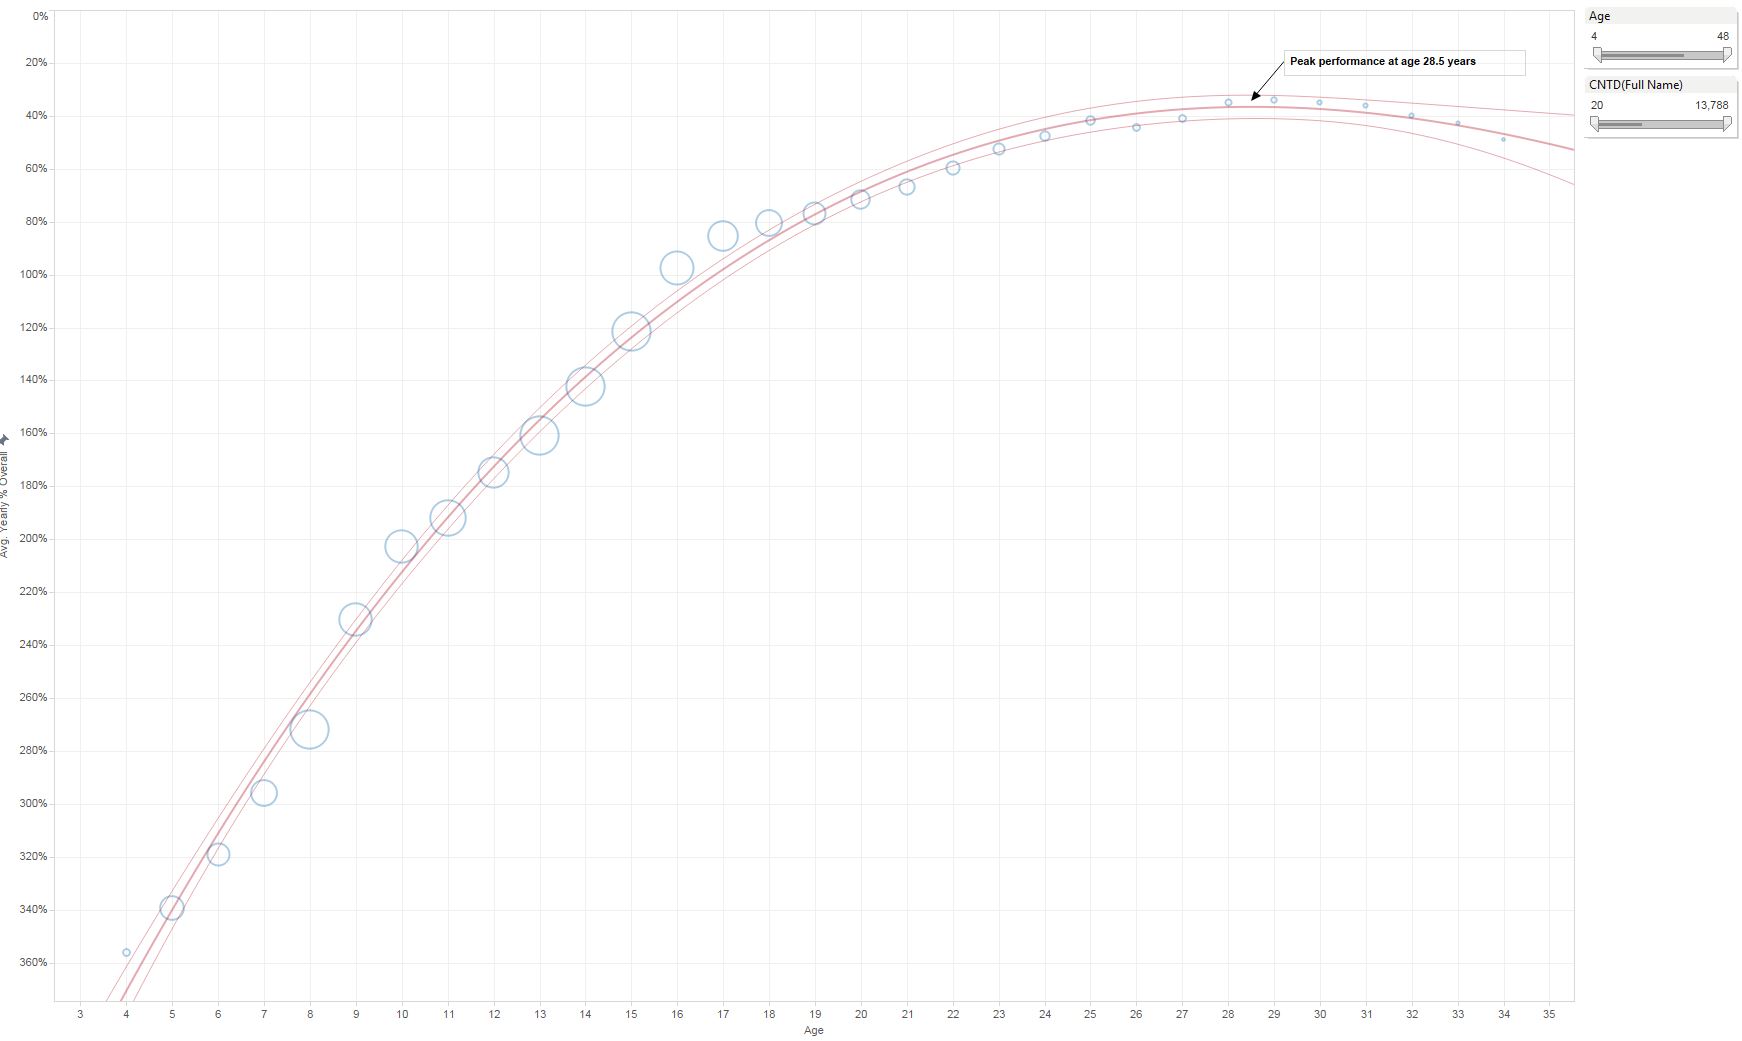
Finally, if you aren't bored yet, let me go into using a cubed function to fit the Aging Curve. As you can see below, using the third power provides a better fit line than the parabola, especially for the older riders. My hypothesis is that the cube function actually describes the suvivor bias better. IF (that's a capital IF!) riders really do have a more shallow decline, as predicted by the cubed function - which is to say, riders that elect to keep riding into their 30's are not subject to the steep aging curve of the typical rider -- then the cubed function may actually have more predictive power AND would push the peak age out a little bit toward 28+ years old (28.5 in the image below). Right now, that's not my biggest concern, but here you go:
Posted by: Sagehen MacGyver47 :: As always - Feedback welcomed
But one problem is an issue called "Survivor Bias" where--in our case--only those good enough to compete well hang around into their older years. Those who are not good enough drop out. So in our case, riders who are still competing at 30, 35, 40+ are likely artificially inflating the average % Overall for their age group. For instance one 30-year-old pro finishes 10th one year while another 30-year-old pro finishes in the 30th. In this hypothetical sample, the average would be 20th for 30-year-olds. The better pro decides he can still give it a shot, but the worse pro decides it's time to keep the bike in the garage. Next season the better rider, now 31, finishes 12th. Since the other rider retired, the new average for 31-year-olds is 12th, which is actually better than 15th. But, this "improvement" is not because the riders got better between their 30-year-old and 31-year-old seasons, it's because the worse rider left the sample.
This bias in the data is generally understood to be uncorrectable by statistical methods or sampling methods. We can't go back and make the missing riders compete. So, we do what we can in terms of the aging curves and also remain aware of it's potential to skew results. In the aging curve above, I've limited the upper age to 34 for two reasons. One is that in our data, ages 35, 36, and beyond are way above the curve -- you can see these data points and alter the curve above if you remove both filters from "Age" and "# of riders at the specific age" at the top right. Also, the age ranges above 34 each had fewer than 20 riders' data to draw from, which--albeit a bit arbitrary--was below the cutoff of n=20, which seems like a fairly low bar that these groups couldn't clear.
The peak age based on this is 27.75 years. It was 26.75 for Supercross. Both of those numbers sound reasonable, as the peak age in baseball is considered to be somewhere around 27. I'm leaning toward the 26.75 number rather than the 27.75 number, mostly because I think the survivor bias for older riders is affecting the MX data more than the SX data. If I had to guess an age for where the average MX rider peaks, I'd say 27 years old. (Also, if you take that slider above and get rid of everyone over 30, you see that peak age drop to about 26. Just saying.) But there's more work to be done in determining what aging curves apply where -- separating pros from also-rans, looking at what affect injuries has on these numbers, and determining what aging curve should apply to what class of rider.