Rider Profile: Jason Anderson – Nature-Vs-Nurture?
Jason
Anderson has gone from 450SX “dark horse” to legitimate contender in a matter
of two weeks by winning one race and finishing near the top of the other –
though it might be an exaggeration to proclaim that he came out of
nowhere. The 22-year-old (22 years &
11 months, mind you) was catching many eyes leading up to the beginning of
the season with many saying his speed had improved enough for him to be a
potential wildcard and to reach several podiums. Many riders made predictions about 2016, and several saw
Anderson as a possibility for the podium at A1, but he was not picked by any
(but one, Damon Bradshaw, who picked Tomac and Dungey for #2 and #3) as being a
factor after five races. Would their
answers differ now, based on what we’ve seen?
That
gives us some idea of how Anderson compared to the average rider – he was much
better overall – but it doesn’t necessarily tell us about how he compared to
the elite riders that he’s now
competing with at the top of 450SX. Let’s
compare Anderson’s amateur and early pro years in the %-ile Overall chart to
some other riders, to see if we can get an idea if perhaps he was already
primed for success, or if this supposed magical offseason training is what was
needed to get him to the next level.
Compared to Davi Millsaps:
Stay tuned for 2016 450XS predictions updated
with results from last week’s San Diego race.
P.S. -- The next time we see Anderson pass
Seely and the announcers decry Seely’s lack of finishing ability or grit or
what have you, I think we can point to the fact that Anderson’s shown better
results all along his career and it’s not so much Seely’s lack of toughness (or
whatever claim gets put forth) as it is Anderson simply appears to be a better
rider.
Footnote: What’s
behind the %-ile Overall graph?
After
Anderson’s impressive amateur career and a 250SX West season championship in
his fourth year at that level, his rookie 450SX season was less
encouraging. A 2nd-place finish at
Anaheim in the first week of 2015 was exciting, but the success didn’t hold up
as he had only two more finishes above 6th the rest of the way – although, he
was in the top 10 for all but 3 races.
Certainly not bad for a rookie, considering he finished 7th
overall, but I don’t remember (and can’t find) any who said at the end of the
season: “there’s a top contender for next year”.
Now,
in his second season, Anderson has shown quite an amazing improvement (granted,
through only two weeks). Most of the
coverage and stories about his newfound success point to Anderson’s offseason with acclaimed trainer
Aldon Baker who
trained Anderson next to other top riders – Ryan Dungey and Marvin
Musquin. So, what I’d like to take a
look at is whether Anderson’s 2016 success (so far) is due to his offseason
training or if perhaps Anderson was this talented all along and was likely to
achieve this level of success regardless.
Or maybe it’s all a mirage, and we should expect that Anderson’s remarkable
start will fade as the season goes on and he drifts back to the pack.
From
a preseason projection standpoint, we used his 2015
season data (his only 450SX season) and factored in an age adjustment, assuming
that he will improve from his 21-year-old season to his 22-year-old
season. One thing that is deceptive
statistically about his 7th-place finish overall in 2015’s 450SX season is that
his relatively high rank in the standings was driven not just by high finishes
in the races but also by volume of races.
His average finish was 9th (technically 8.8) – still not bad, but those
two spots matter. He competed in all 16
races, though, which means he was earning points when Ken Roczen, Davi Millsaps,
James Stewart, and Justin Barcia were on the sidelines – I
think we can agree that if Roczen, Millsaps, Stewart, and Barcia had completed
full seasons, at least 2 of the 4 would have finished ahead of Anderson,
thereby leaving Anderson somewhere between 9th and 11th. So, going into 2016, our prediction (omitting
injury potential) ranked these 4 riders as well as Musquin ahead of Anderson.
So,
what changed in two weeks? Blake Baggett started the season on the
injured list, Stewart got hurt at the start of the A1 final, and Musquin
appears to have been rated too high based on the little 450SX info we had for
him (4 races from 2012) based on what we’ve seen so far. But that leaves many other racers who were
predicted ahead of Anderson (by us and others) yet are currently behind him in
the standings and haven’t looked nearly as good on the track. Two weeks is way too early to draw major
conclusions, but if Anderson’s fast two races are indicative of a new talent
level for him, then let’s look back at his history to see if his amateur and
professional profile shed some light on where his newfound success comes from
and if there were any indicators back then.
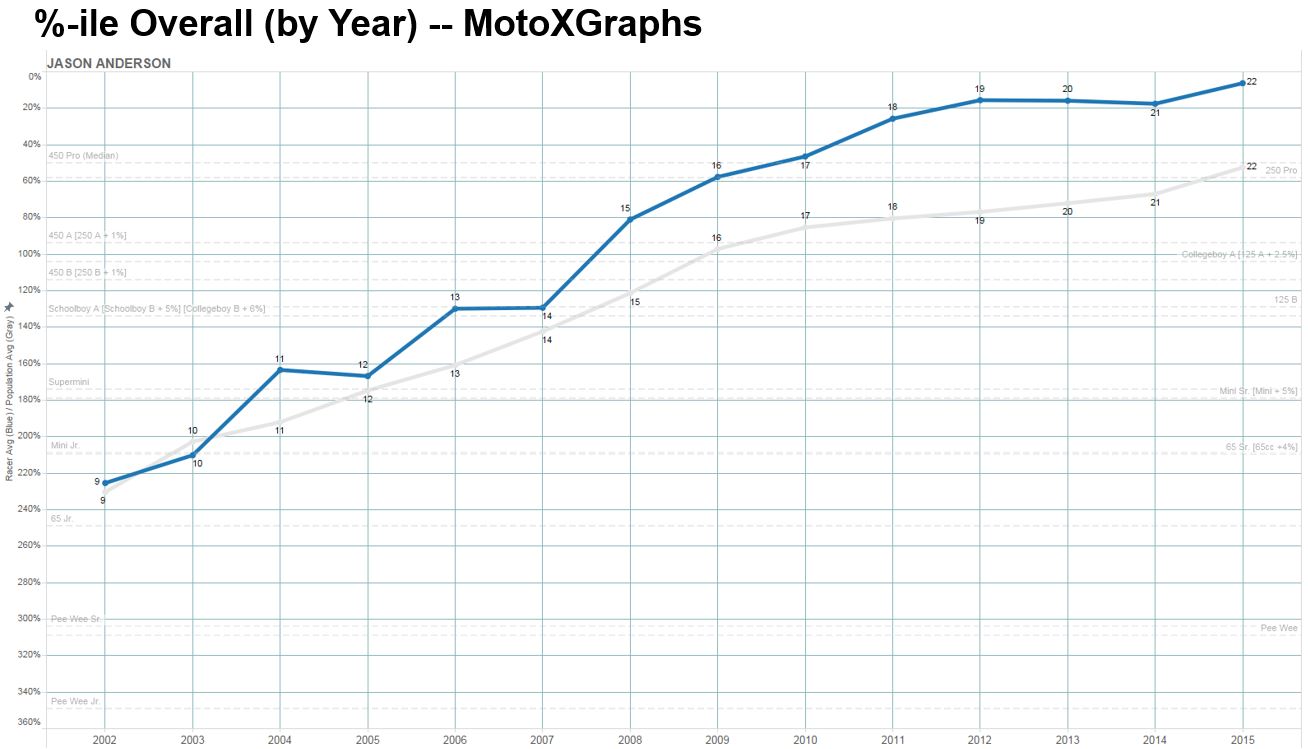
Taking
a look at Anderson’s track record, our data goes back to his age 9 season in
2002. The “%-ile Overall” chart shows
how the rider performed each year relative to ALL pro and amateur riders, and
compares to the average rider at that age (gray line) (see Footnote below for full details on
the %-ile Overall chart). The dashed lines
are there as a reference to show where the average rider in each of the classes
(condensed – more details in the Who? page) would land.
Keep in mind that “average” in this chart is relative to riders only
from A/B/Open and Pro level races, so it’s not a comparison to all riders in
existence – it’s a comparison solely to the upper level of riders. For Anderson, we can see he’s been
significantly above average since early in his youth:
 (Sidenote: I don’t think age-9 performance is
particularly predictive of long-term success (probably also true of 10, 11,
even 12 years of age, though the analysis on that is still pending) – but I’ll
display it anyway. Of course as the
rider gets older the results do become more and more predictive.)
(Sidenote: I don’t think age-9 performance is
particularly predictive of long-term success (probably also true of 10, 11,
even 12 years of age, though the analysis on that is still pending) – but I’ll
display it anyway. Of course as the
rider gets older the results do become more and more predictive.)
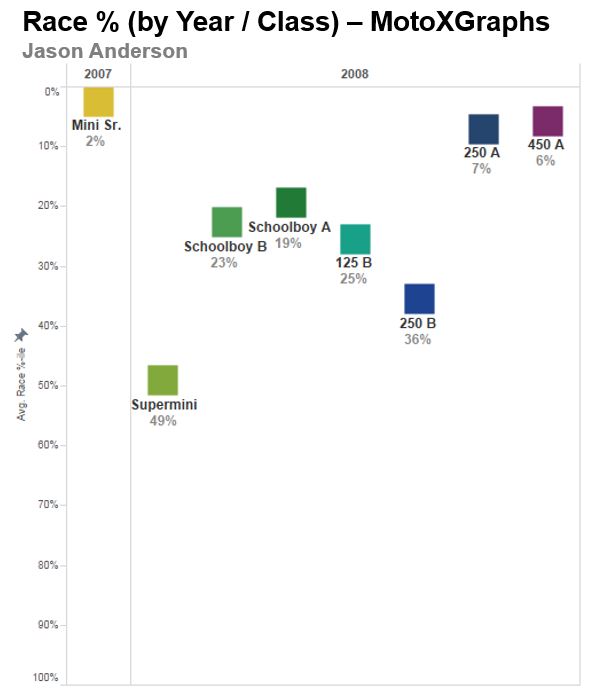
There’s
a noticeable leap in his results from age 14 season to age 15. In the age 14 season, he won two Loretta’s
finals races in the 85cc/Mini Sr. class, which is quite a feat. So how was his next season even better? In his age 15 season, his average rank in his
races in our data set was #7, while his average “race %-ile” was 22% (which
means on average he finished in the top quarter of his races). Even though this is lower in terms of
ranking/percentile than what he did in his age 14 season, he raced in classes
ranging all the way up to 250A and 450A – so finishing lower in the more
difficult classes actually produced a better year by this metric. (FYI, he also won the Loretta’s finals race
for the Schoolboy B/C class.) The “Race
%” graph below shows how he finished at the top of the Mini Sr. class in 2007
but had various results in a number of more difficult classes in 2008:
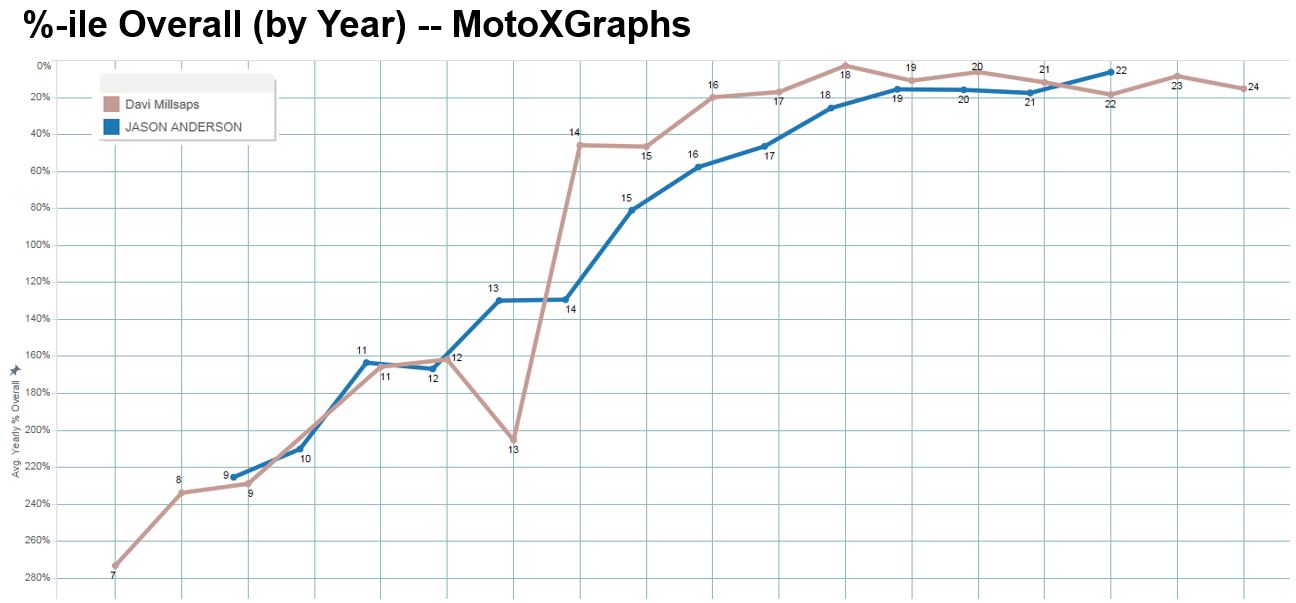
That’s
a pretty big gap in their age 14 through 19 seasons, with Millsaps maintaining
an edge up until their 22-year-old seasons.
For Anderson, that takes him through this most recent MX season, where
the noticeable improvement happened. But
the data doesn’t include (yet) the current 2016 Supercross season – which would
indicate that Anderson had shown a noticeable improvement even before his offseason training. Let’s add in Cole Seely, whose MX results,
interestingly, rate below both of the others’ during pretty much Seely’s entire
career:
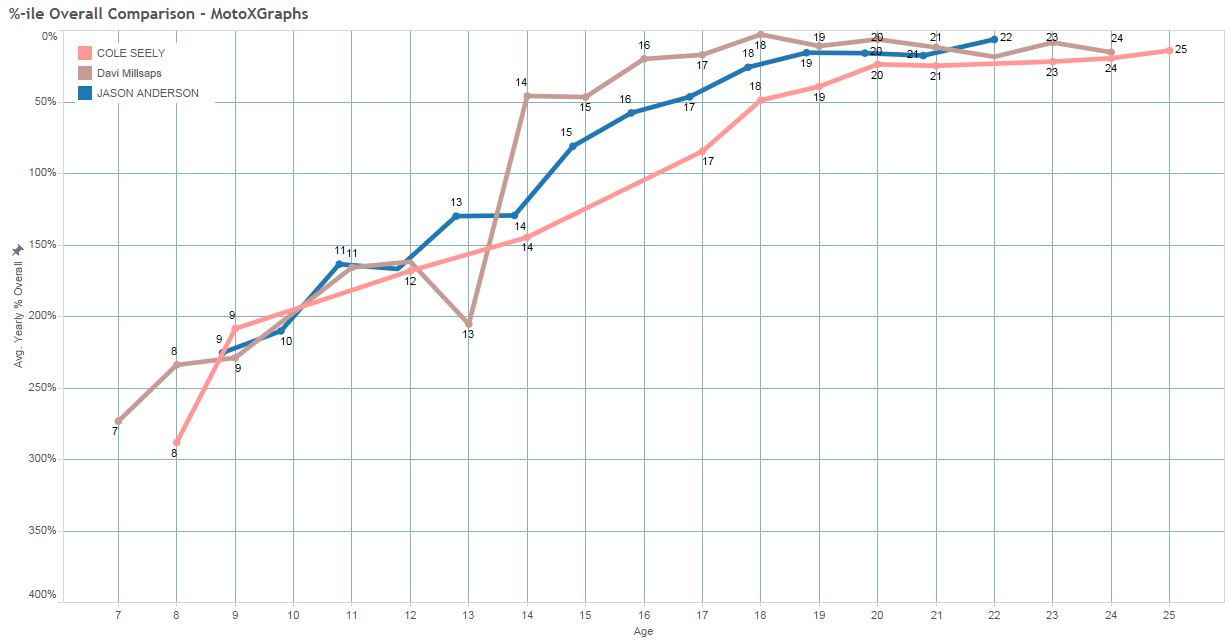
Again,
this doesn’t include Supercross, and our 450SX predictions rely only on
historical 450SX results, so Seely was predicted at 9th—just above Millsaps
(10th) and Anderson (12th)—based largely on his good 2015 results. Seely’s good start for 2016 may show that his
2015 was not a fluke but a legitimate improvement, but we’ve got a ways to
go. And if the first two races are any
indication, Anderson is poised to continue his previous trend of better success
than Seely has had. Millsaps, on the
other hand, has 6 seasons where he’s finished in the Top 3 for 450 Motocross or
Supercross by his age 27 season. Based
on Anderson tracking consistently below Millsaps through age 21, I’d be
skeptical that Anderson could do the same.
This
comparison is so much fun, I’ve added a tool here: %-ile Overall Comparison.
Couple more.
Anderson and Trey Canard – just like Millsaps, Canard jumped up to a
good amount of success earlier than Anderson, though there’s not quite as big a
gap:
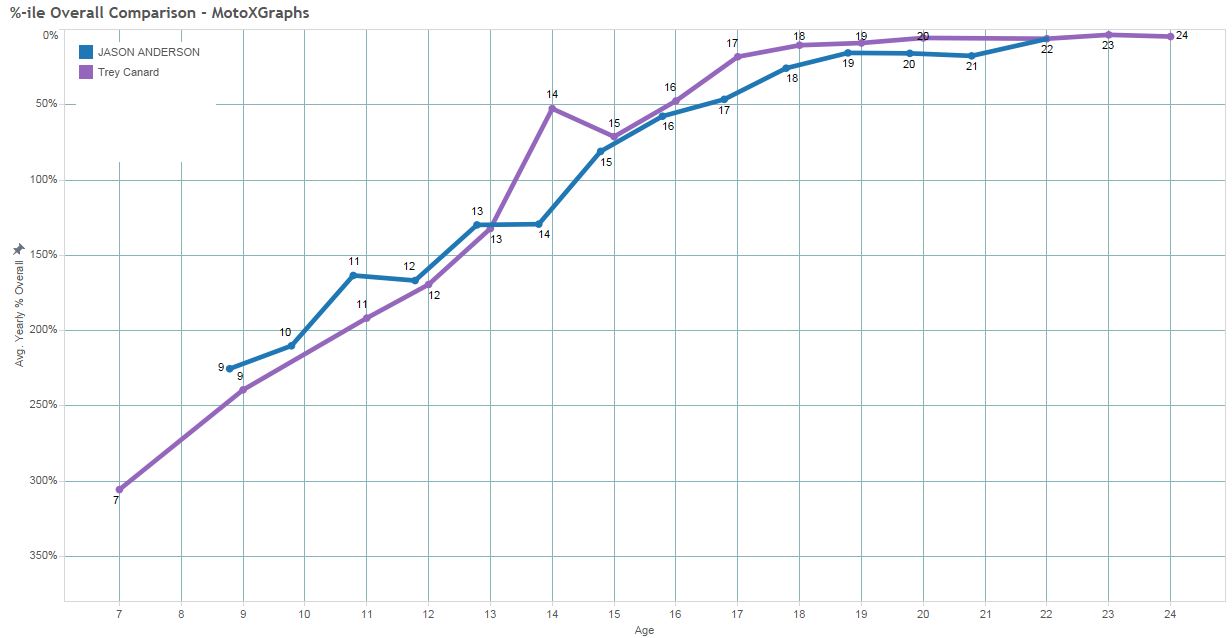
After Canard’s 17-year-old season (where he
really distances himself from Anderson in the graph), Canard has ridden at an
extremely high level…when he’s healthy.
But, again, if you’re looking at this chart alone (not that we are or
that we would), then I think you see Anderson lagging behind Canard, and I
don’t think you expect the same amount of success from Anderson as Canard –
unless that age 22 improvement from Anderson reflects a new level of performance
and not a one-time blip of random success.
Finally,
let’s look at Stewart and Dungey, one of whose track record looks about as
expected, the other a bit surprising (to me, anyway). Stewart distances himself from Anderson in
the age 15 and 16 seasons, then maintains his well-known high level of success
that Anderson has not quite approached.
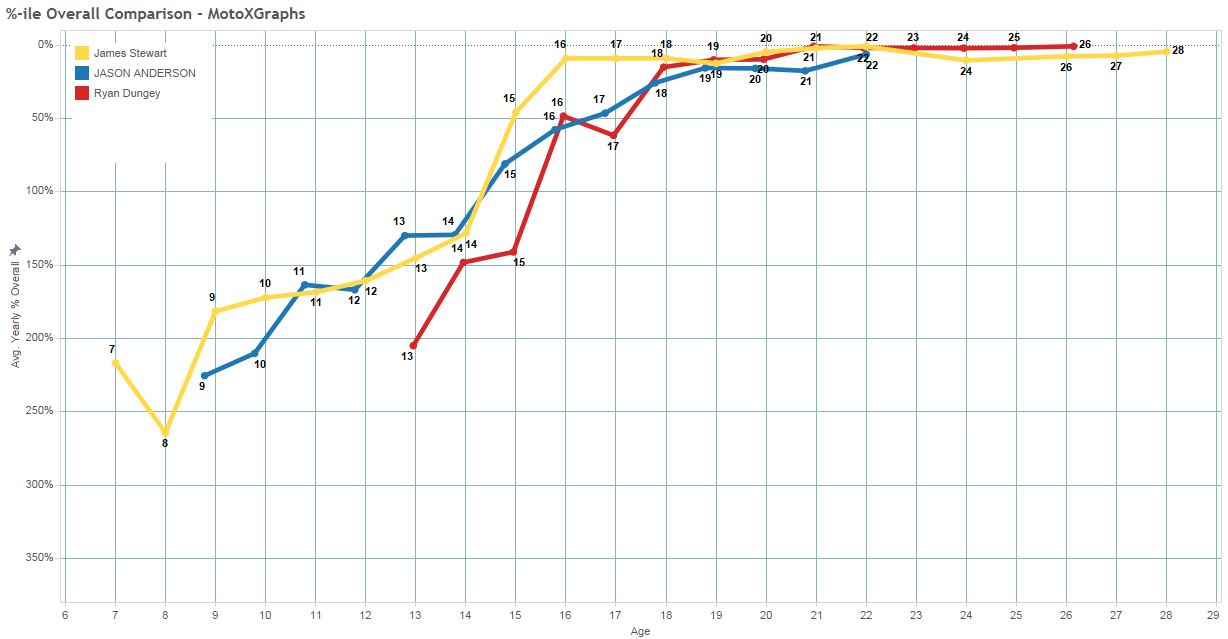
Dungey, on the other hand, rode a mix of
amateur 125cc and pro 250 class races in his age 17 season, which was the 4th
year out of 5 in which he was below the performance level of Anderson at
corresponding ages. After that, of
course, Dungey’s results jump up, and within a few years he runs along the top
of the graph (note that I had to extend the axis to show the age numbers for
Dungey because they were above the 0% line).
Perhaps Dungey had a late start on his development because of growing up
in the cold-weather (a phenomenon well-known for many outdoor sports) of
Minnesota, but that’s a topic (albeit an interesting one) for another day. But the point here is that sometimes top
rider’s growth curves look just like they should (i.e. Stewart’s) and sometimes
they don’t – even for an eventual superstar like Dungey.
So,
are we closer to figuring out our question – is Jason Anderson’s improvement
coming from Nature or Nurture? Yes,
Anderson went through a new training program with a vaunted trainer – but,
young riders improve, generally speaking.
That’s Nature—and Anderson appears to be approaching riders like
Millsaps and Canard in terms of performance level while already outpacing
Seely. All this riding at a high level
was happening before Anderson went through his offseason training, as possibly
seen in the mini-spike from his 2015 450MX season, and again that points to
Nature. On the other hand, if Anderson
makes a legit run at #1 for 450SX the rest of the way in 2016 and/or puts up a
convincing 2nd-place finish with a big margin, then that certainly opens the
door for the Nurture argument – something seems to have pushed him up to a
level way above Millsaps or Canard or Tomac, etc. If he falls back to the pack…well, I think
it’s hard to argue that his training program got him there rather than his
existing talent. Only time will tell,
and that means it’s time to look forward to Week 3, back in Anaheim this
Saturday!
P.P.S. -- One last comment is that Musquin
also trained with Aldon Baker and Anderson/Dungey this offseason, but I haven’t
heard any remarks from commentators about Musquin’s failure to surge up the
leaderboard. Odd how the Nurture
argument fits the pattern for Anderson but no so much for Musquin, yet we don’t
really hear about the latter.
First,
we have to cover Modified Advancement Points (mAP) (Yes, lowercase “m”. No, I don’t really know why, that’s just how advanced
stats represent that something is different from the original: with a lowercase
letter). The
idea is that they’re still a form of Advancement Points – awarded to riders for
how well they perform in a race. But
unlike the traditional stat, Modified Advancement Points are scaled against the
average rider in the race, rather than just a sliding scale down from
first. Also, while both AP and mAP
attempt to reward riders in races with more entrants by awarding more points,
AP uses a simplified method (as they should, considering that it needs to be
easy to interpret and apply) and mAP uses a method that awards an amount of
points precisely specific to the number of riders in the race. Riders finishing above average in a race are
awarded positive mAP, and riders finishing below average in a race are
awarded—hold on to your hats here—negative points.
Then,
before mAP can be “final”, an adjustment is made to factor in the quality of
the competition in the race. Riders
competing in a Loretta Lynn Regional Qualifier or Final are given more mAP than
riders in other races. Once that
adjustment is made, we can average points per rider and look within, say, the
Schoolboy B class and see who in the country performed well and who didn’t in a
particular period of time. In this case,
in each year we rank every rider in each class in terms of percentile, where
the best riders are in the 1% (or smaller, if the class has more than 100
riders) range, and the worst riders are in the 99%+ range.
Once
we determine how all the riders stack up within the classes, we have to put
each class in context with the others.
How does the rider who did well in the Schoolboy B class compare to a
rider who did well in, say, the Supermini class. By looking at riders who compete in multiple
classes within the same year, we determine the adjustment to apply to results
from each class so that we can relate them to each other. Essentially, you can start with the 450 Pro
MX class (aka “Upper Pro”), where riders are ranked from 1% to 100%, then
compare to the 250 Pro MX class (aka “Lower Pro”). The question is, essentially, if a rider
finishes 50% (exactly average) in the 250 Pro MX class, where would he finish
if he went up a level into the 450 Pro class?
Let’s say, for ease of use, that he would finish at 60% -- a 10% penalty
(it appears to be more like an 8% penalty).
Then, a rider who finished in the 10th percentile in 250 Pro would be
expected to finish around the 20th percentile in 450 Pro; or, if a rider
finished at 75% in 450 Pro, he would have been expected to finish at 65% in 250
Pro. From there we can compare 250 Pro
to the 450 Amateur class – a 36% penalty, and all down the line.
Now
that every racer’s results are put into “%” context in terms of size of the
race, quality of competition, and class, we can compare any race result with
another. For the %-ile Overall chart, we
average a rider’s results for each year in terms of % and we can trace a
rider(s) progress from year to year, either by age or by calendar year (or
both).
(Note:
The terminology of “%” is used to indicate how the values are structured, but
the idea of % starts to break down when you compare very disparate classes –
for instance 250 Pro and Supermini, where the “penalty” would be 116%. So even the best rider in Supermini, if he
somehow managed to ride in the 250 Pro class, CAN’T, by definition, finish at
the 116th percentile. In terms of
ranking and percentile, the “%” is sort of a figure of speech, if you
will. I could re-calibrate the % scale
so that everyone fits within 100%, but I like the idea that the Upper Pro class
is a nice round 1% through 100%, and everyone else is relative to the top
class.)
(I’ll copy this into the “What?”
page, for future reference. Oh, and in
the %-ile Overall Comparison Chart page linked above.)
Posted by: SagehenMacGyver47 ::: As always – Feedback welcomed
Previous: San Diego 1 – By-The-Numbers Recap | Back to Blog | Next: 2016 Supercross Predictions - 450SX Update after week 2 at SDSX1