Rider Profile: Eli Tomac – Can he rebound again?
When
I look at Eli Tomac’s progress over time, from amateur to pro, the thing that
stands out to me is his amateur seasons at age 13, 14, and 15, where he showed
very little improvement in the advanced numbers. His age 15 season, in particular, graded out
as almost exactly average – if I’d seen his numbers only up to age 15, I’d be really skeptical that he was bound to be
a top 450 Pro. (See below, where Tomac's progress (blue line) can be compared to the grey line that represents the average rider; Tomac's age is noted at each dot, and the year is shown on the X axis. The dashed light-grey lines represent where the average rider in that class would end up.)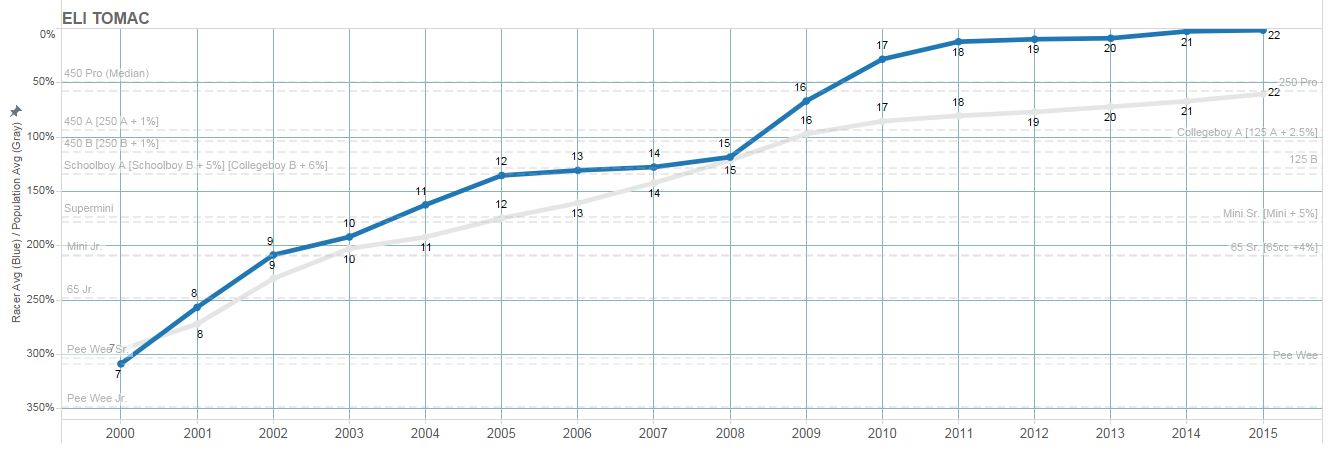
Then,
in his following two seasons, his performance
jumped back up. As a 16-year-old in
2009, he left the mini bikes behind and rode only in A and B classes of
Schoolboy, 250, and 450. Compared to
2008, his average finish in 2009 didn’t improve (11.1 %-ile in 2009, vs 9.5
%-ile in 2008), but as we’ve seen before,
riding in more difficult classes can make much more difference than just the
finish position. Add in that he won both
the Schoolboy B and 250 B races at Loretta’s, and that caps off the marked
improvement in 2009. Then, in 2010, his
numbers jumped again for his 17-year-old season as he rode only in the 250A,
450A, and 250 Pro classes. He won his
first pro 250 race, and he averaged a finish of 7.5 (18.8 %-ile) in his pro
races, which is clearly way above average for a 17-year-old.
So
at that point, what do we believe? The
general consensus that he’ll be a star? By the advanced stats, he looked somewhat average as a 14- and 15-year-old,
then like a potential top pro at age 17 – however, he faded down the stretch. The
next year in 2011, at age 18, he finished 2nd in 250 West Supercross and 4th in
250 Motocross, and backed up the idea that he would succeed at the highest
levels. In 2012 he would win the 250SX West
title, and in 2013 he won the 250MX title.
Having won 250 titles in both MX and SX, he moved to the 450 bike
full-time in 2014. The question now for
Tomac, like for so many others, is how well could he transition to the bigger
bike and to better competition.
His
first full 450 season attempt, at age 21, was doomed by injury. Coming in to the 2014 SX season late, he
started slow while recovering from injury, but Tomac finished relatively well with a
2nd, 6th, 9th, 4th, and 2nd to end the season (although he missed a few races
in the middle). His 450MX season had
only 8 completed races, but he reached the podium in all but 1 (finished 7th),
which included 1 win. In 2015, for his
second run at 450SX, he picked up where he left off, finishing 2nd overall,
including 3 race wins. His 450MX season also
had a great start, as he won the first 5 motos. But it did not end well, when
in the 6th moto he crashed hard and injured both shoulders, tearing a rotator
cuff in one and dislocating the other.
Even
though 3 of his first 4 seasons on the 450 have been marred by injury, if we
look at how well he performed in the races he did complete, his age 21 and 22
seasons were clearly better than those of Davi
Millsaps and Jake Weimer (two
guys in their upper 20’s that I like to use as a gauge). He is even on the level of Chad Reed when Reed was at those ages,
which is probably overstating things, but even if so, it says something to be
mentioned as being close to Reed’s level. 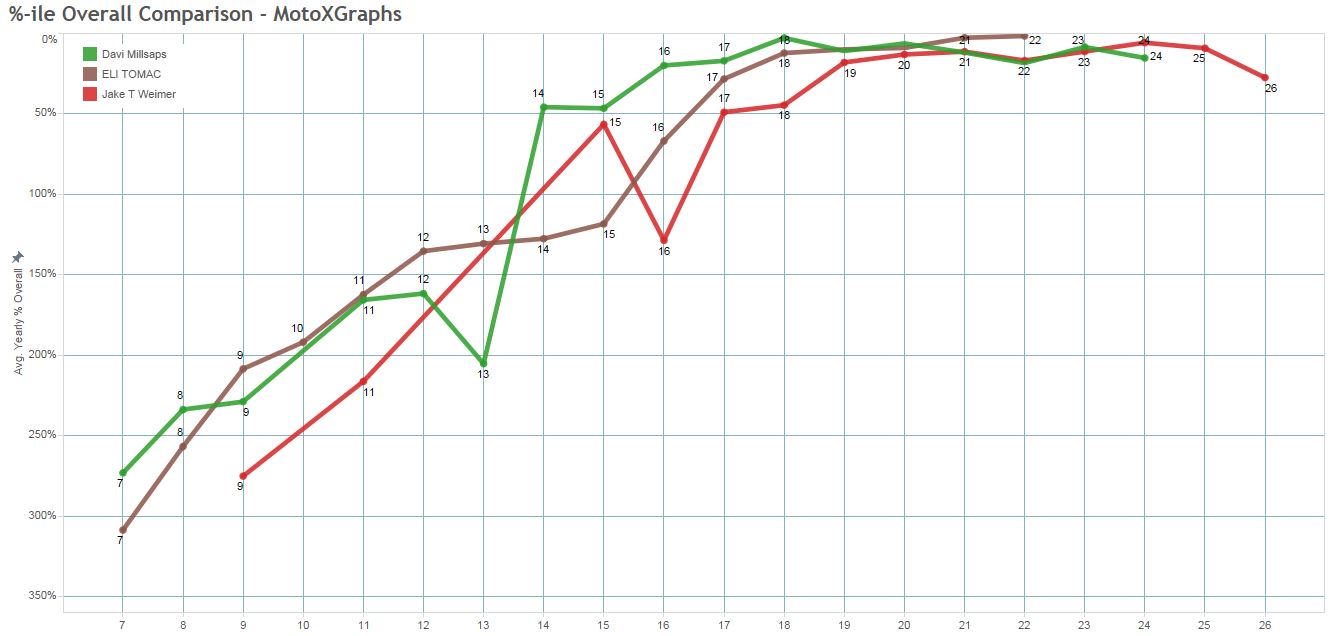
(That chart is from the %-ile Overall Comparison page.
Considering
Tomac’s success at the upper levels of Loretta’s, in the 250 pros, and in the
450 pros (when healthy), it seems safe to say that whatever blip we saw in his
age 14 and 15 seasons is a thing of the past.
The new question is whether he can maintain his level of success from
2014 and 2015 – not just by staying healthy, but can he really excel and finish
above the likes of Dungey, Roczen, and others?
The beginning of the 2016 SX season has so far been a disappointing answer
for Tomac. He currently sits in 6th,
with 3 finishes in 4th and 1 in 7th. Two oft-mentioned
factors are his new bike manufacturer and his recovery from
shoulder surgery after the 2015 season-ending crash. While we can’t really measure the impact (or
lack thereof) from those directly, we can look at another potential culprit: not
getting good starting position off the line.
One
year prior, in 2015, Tomac’s average starting position was 6.1 – not great, but
not bad. In the 5 races from 2015 that he started
5th or better, he finished 1st or 2nd every time. In the races he started 6th or worse, he
finished from 2nd to 7th, plus twice finishing 20th because of crashes. In the first 4 races of 2016, Tomac’s
starting position is down to 8.7 – more than two spots below his 2015 average. That sounds bad, but I think it looks even
worse when you see that the starts were 3rd, 10th, 10th, and 12th – his lowest starting
position in all of 2015 SX was 9th. So something
clearly is off, and it’s up to Tomac and his team to figure out what. Almost 10 years ago he rebounded from a lull, but can he do it again?
Footnote: What’s behind the %-ile Overall
graph?
First,
we have to cover Modified Advancement Points (mAP) (Yes, lowercase “m”. No, I don’t really know why, that’s just how
advanced stats represent that something is different from the original: with a lowercase
letter). The
idea behind mAP is that they’re still a form of Advancement Points – awarded to riders for
how well they perform in a race. But
unlike the traditional stat, modified Advancement Points are scaled against the
average rider in the race, rather than just a sliding scale down from
1st place. Also, while both AP and mAP
attempt to reward riders in races with more entrants by awarding more points,
AP uses a simplified method (as they should, considering that it needs to be
easy to interpret and apply) and mAP uses a method that awards an amount of
points precisely specific to the number of riders in the race. Riders finishing above average in a race are
awarded positive mAP, and riders finishing below average in a race are
awarded—hold on to your hats here—negative points.
Then,
before mAP can be considered “final”, an adjustment is made to factor in the quality of
the competition in the race. Riders
competing in a Loretta Lynn Regional Qualifier or Final are given more mAP than
riders in other races. Once that
adjustment is made, we can average points per rider and look within, say, the
Schoolboy B class and see who in the country performed well and who didn’t in a
particular period of time. In this case,
in each year we rank every rider in each class in terms of percentile, where
the best riders are in the 1% range (or smaller, if the class has more than 100
riders), and the worst riders are in the 99%+ range.
Once
we determine how all the riders stack up within the classes, we have to put
each class in context with the others.
How does the rider who did well in the Schoolboy B class compare to a
rider who did well in, say, the Supermini class? By looking at riders who compete in multiple
classes within the same year, we determine the adjustment to apply to the results
from each class so that we can relate them to each other. Essentially, you can start with the 450 Pro
MX class (aka “Upper Pro”), where riders are ranked from 1% to 100%, then
compare to the 250 Pro MX class (aka “Lower Pro”). The question is, essentially, if a rider
finishes 50% (exactly average) in the 250 Pro MX class, where would he finish
if he went up a level into the 450 Pro class?
Let’s say, for ease of use, that he would finish at 60% -- a 10% penalty
(it appears to be more like an 8% penalty).
Then, a rider who finished in the 10th percentile in 250 Pro would be
expected to finish around the 20th percentile in 450 Pro; or, if a rider
finished at 75% in 450 Pro, he would have been expected to finish at 65% in 250
Pro. From there we can move down a level to compare 250 Pro
to the 450 Amateur class – a 36% penalty, and etc., all the way down to the Pee Wee classes.
Now
that every racer’s results are put into “%” context in terms of size of the
race, quality of competition, and class, we can compare any race result with
another. For the %-ile Overall chart, we
average a rider’s results for each year in terms of %, and we can trace a
rider(s) progress from year to year, either by age or by calendar year (or
both).
(Note:
The terminology of “%” is used to indicate how the values are structured, but
the idea of “%” starts to break down when you compare very disparate classes –
for instance 250 Pro and Supermini, where the “penalty” would be 116%. So even if the best rider in Supermini somehow managed to ride in a 250 Pro class race, he CAN’T, by definition, finish at
the 116th percentile. In terms of
ranking and percentile, the “%” is sort of a figure of speech, if you will. I could re-calibrate the % scale so that
everyone fits within 100%, but I like the idea that the Upper Pro class is a
nice round 1% through 100%, and everyone else is relative to the very top class.)
Posted by: SagehenMacGyver47 ::: As always – Feedback welcomed
Previous: 2016 Week 4 - By-The-Numbers Recap: Oakland | Back to Blog | Next: 2016 Supercross Predictions - 450SX Update after week 4 at Oakland