How Much Do Riders Slow Down Throughout A 450SX Race?
It's a given that as the race goes from Lap 1 to Lap 20, the riders slow down. Some of that is due to getting tired, and some from the track getting torn up. Some of that is due to riding conservatively because they can't catch the person in front of them and/or they don't fear getting caught from behind. That much is clear, but what I want to know is how much do riders slow down throughout the race? How does that compare for the top riders, say Ryan Dungey vs Ken Roczen? I'd also be interested in Eli Tomac (coming off an injury), Jason Anderson (seems to start slow and finish strong), and Chad Reed, among others. Also, do the riders tend to put it in cruise control when they've got a big enough lead, riding a bit slower than if they were chasing the leader -- and can we see it in their lap times?
Riders Slow Down
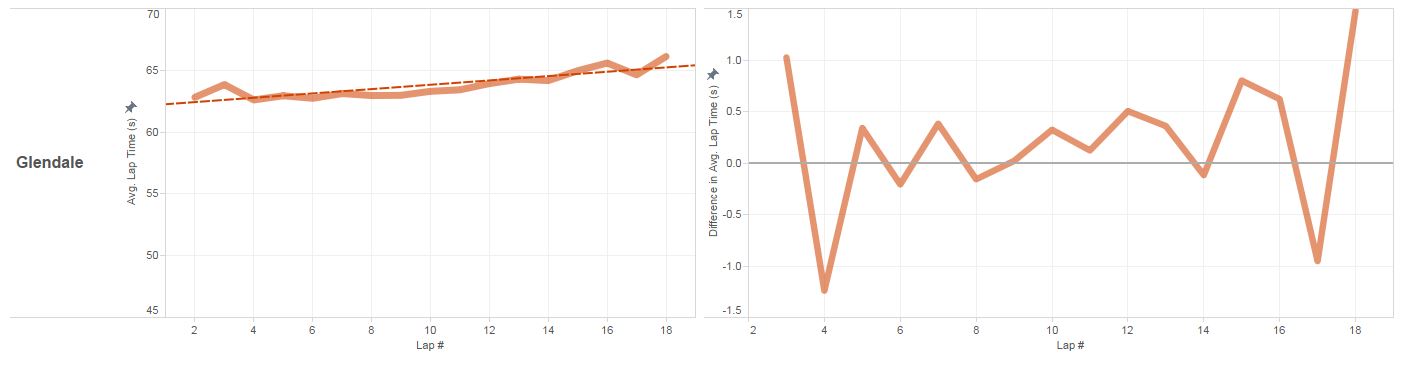
So far in 450SX this season, here's what the average lap times look like going from Lap 2 through Lap 18 (as before, we're ignoring laps 19 & 20 because riders typically slow WAY down in those laps, often by a second or more, since they can't catch up or be caught; we're also ignoring Lap 1 because that time is not comparable with the others due to beginning at the starting gate instead of crossing the finish line). The steeper the trend line, the more slowing you have from lap to lap. On average, this season's riders have been slowing down by 0.1 seconds per lap:
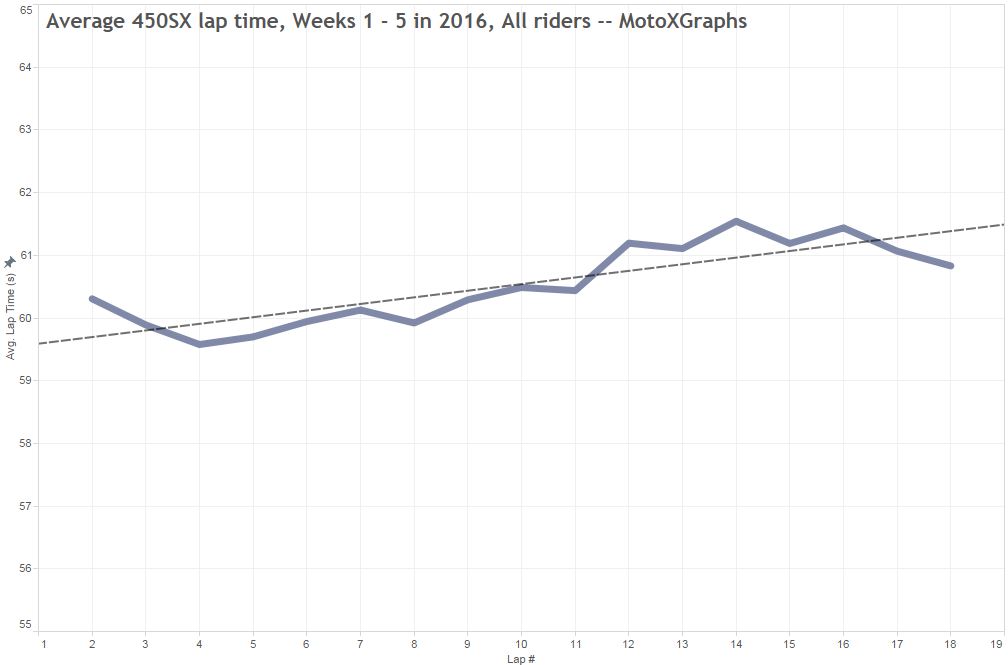
(Please note that on many of these graphs I am truncating the axis rather than going all the way to 0. Usually a no-no. But let's throw caution to the wind.)
From The Top Down?
That's the average rider, but what about at the top? Ryan Dungey now has 5 races in 2016 450SX for us to work with. Most importantly, with the 2nd-place finish in Glendale, it gives us 2 races where he never got to 1st. In those races, he assumedly never would have been able to go into "cruise control" mode and conservatively finish the race #1. We could look back into 2015 to increase the sample size, but for now I'm going to look just at 2016 where the races are fresh in our minds and we can compare the lap times to what it "felt" like the riders were doing. In the 5 races, here's what Dungey's average looks like, where he's slowed down by an average of 0.02 seconds per lap:
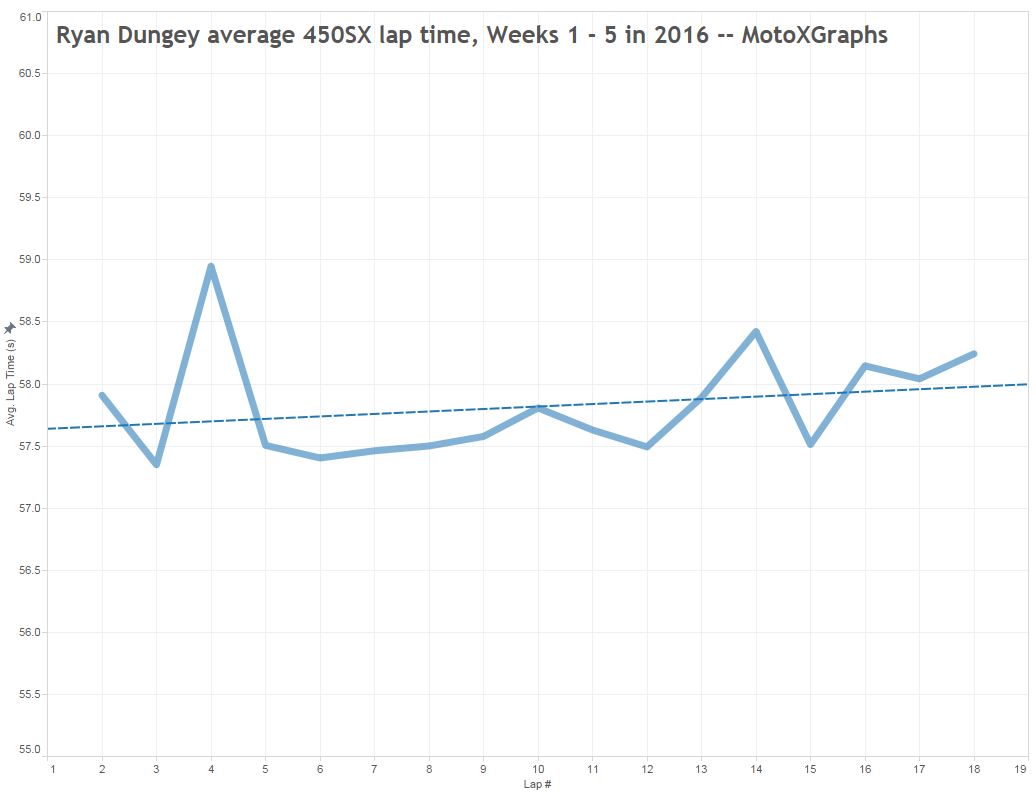
That average of 0.02 seconds is really small, and part of that is due to him getting caught in a couple early spills at Anaheim 1 -- if we remove A1 from the numbers, his average decline per lap is 0.05 seconds, which seems a little more reasonable.
If you were wondering about eliminating laps 19 & 20, then check out what happens if we include them -- there is a big spike for those laps, and the seconds slower per lap increases to 0.07:
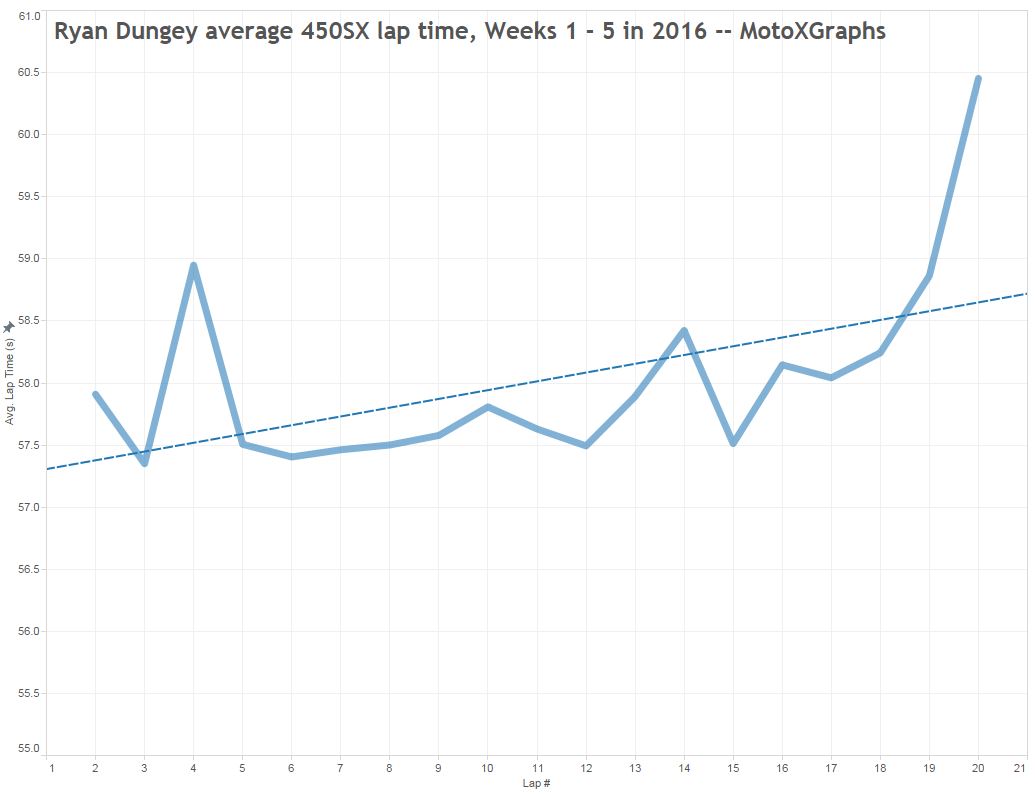
So I hope that visually explains why we're excluding 19 & 20 and focusing on laps 2 through 18.
Here are the 5 races from Dungey so far in 2016, with my perception of the overall race and how hard Dungey would have been pressing to get/hold onto 1st place:
-Anaheim 1
Got tangled up twice, early on, but caught up to 2nd. I would expect that Dungey was running at near full speed the whole way, trying to track down Anderson and to keep riders from catching him from behind.
-San Diego 1
Got out in front fairly early -- Reed hung with him, though, staying within 2 seconds. I would expect that Dungey was running close to full speed but a tad conservative if he felt he could keep Reed at bay.
-Anaheim 2
Got out in front fairly early -- probably cruising at the later stages of the race.
-Oakland
Got out in front fairly early -- probably cruising at the later stages of the race.
-Glendale
Caught up to 2nd after a bad start -- seemed to chase Roczen the whole way.
I would guess that the race-leader's lap times would slow down the most in races where they have the biggest lead. Based on the above descriptions of Dungey's 2016 races (let me know in the comments if you feel differently about how Dungey would have been handling his speed/position), I would predict that his lap times slowed the most in Oakland and Anaheim 2, where he got out to a big lead early. I would predict that his lap times would not slow down as much for Anaheim 1 and Glendale, where he was trying to catch the leader the whole way. And, I would predict that we see something in between those for San Diego 1, where Reed was keeping things close the whole way.
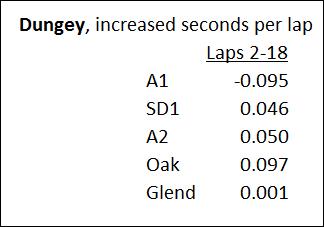
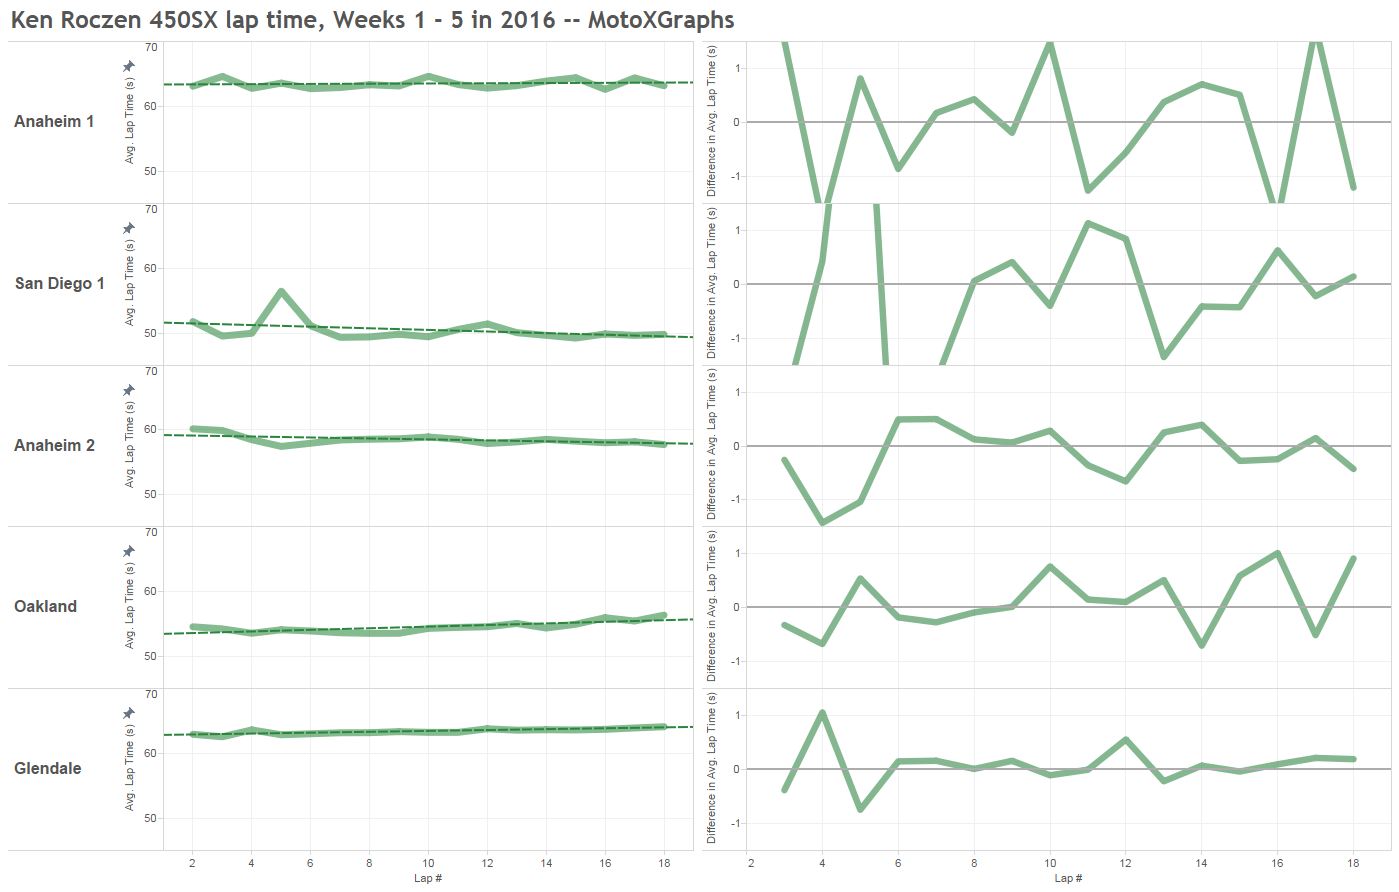
On the left are Dungey's lap times at each race, and since the slope of the trendline is difficult to see, there's a table below that shows the increased seconds per lap that Dungey had in each race. On the right are the changes in seconds from the previous lap. Numbers above zero indicate that the lap was slower than the previous one; numbers below zero indicate that it was faster than the previous.
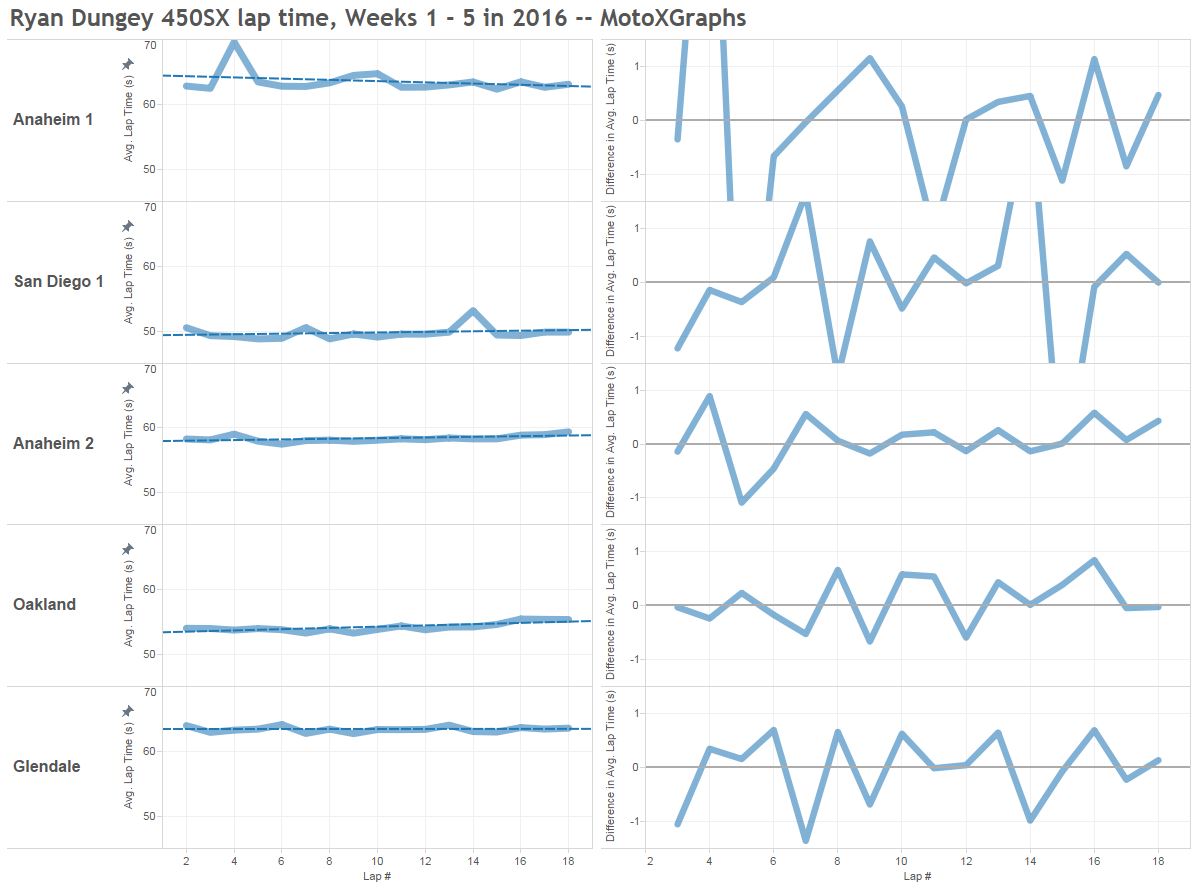
Note that in Anaheim 1 things got a little screwy because Dungey was knocked down, causing him to have one very slow lap early on. Because of this slow lap early in the race, he actually got faster (in terms of the trend line) on average as the race went on. To confirm that it was the slow lap throwing things off, not that he actually got faster as the race went along, we can look at the right side to see that after Lap 6, 6 laps were clearly slower than the previous ones whereas only 3 were faster than previous.
Comparing the numbers, the top two races in terms of increased seconds per lap were Oakland and Anaheim 2, as expected -- though Oakland had a much bigger number (0.097 seconds vs 0.050), which wasn't really expected. Glendale had the lowest increase, at 0.001, which I'm a little skeptical of -- did Dungey really not lose speed as the race went along? But, in laps 2 and 6 at Glendale, Dungey had lap times of 63.97 and 64.11, while in laps 17 and 18 he was at 63.43 and 63.57. So, there were some early laps where he was appreciably slower than ones near the end of the race. Dungy's race at San Diego 1 ended up in the middle, as expected, though at 0.046 it was closer to Anaheim 2 than I thought. And as mentioned, Anaheim 1 had a result that doesn't really make sense because of the really slow lap early on.
How much time did these increased seconds per lap add to Dungey's full race time? 0.8 seconds for San Diego 1, 0.9 seconds for Anaheim 2, 1.7 seconds for Oakland, and less than a tenth of a second for Glendale.
For Ken Roczen, if he has any increased seconds per lap from "cruising", we would expect to see much more of an effect at Glendale where he had a pretty comfortable lead, compared to the first 4 races where he was chasing Dungey or Anderson for the lead:
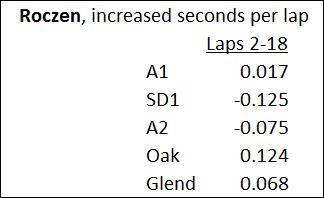
What I see is two races where Roczen had unusual results (negative, that is, meaning he "sped up" during the race). One was San Diego 1, where a very slow Lap 5 was caused by a crash and throws off the whole race. The other is Anaheim 2, where there isn't an obvious culprit. Roczen had very slow Lap 2 and Lap 3 -- more than a second slower than any other lap in the race for him (60.17 and 59.91, compared to his next slowest (Lap 10) at 58.90). He was buried at 9th and 8th during those laps, but that shouldn't have caused such a problem, and rewatching the race I couldn't see anything that was a major problem like a crash. I'd like to chalk this up to getting stuck in the pack, the same way we would with SD1 and the slow Lap 5, but I'm not sure I'm comfortable with that. TBD.
Then there's Anaheim 1, where there was a very small (0.017) seconds increased per lap, which is about what we'd expect, since Roczen's chasing Dungey and Anderson. At Glendale, where Roczen lead nearly the entire race, we see an increase of 0.068 seconds per lap -- similar to what we saw from Dungey in the races where Dungey had a significant lead.
But then there's Oakland, where we have an increase of 0.124 seconds per lap, which is strange because Roczen wasn't leading, as he was 2nd behind Dungey for most of the race. Maybe he felt he was too far behind Dungey and had a big enough lead over Marvin Musquin who was in 3rd? If I look at the Oakland graph on the right side, I see two laps near the end, 16 and 18, that are much slower than his others, so maybe that's evidence he was starting to ride more conservatively at that point, which really affected the number we see.
Looking at Eli Tomac's numbers, the race I'm most interested in is Glendale. While Tomac doesn't have a win to compare against, he mentioned after Glendale that he was unable to really attack in the second half of the race, as he's still getting back into form after his injury. Overall, here's Tomac's lap times in the first 5 weeks, compared to Dungey:
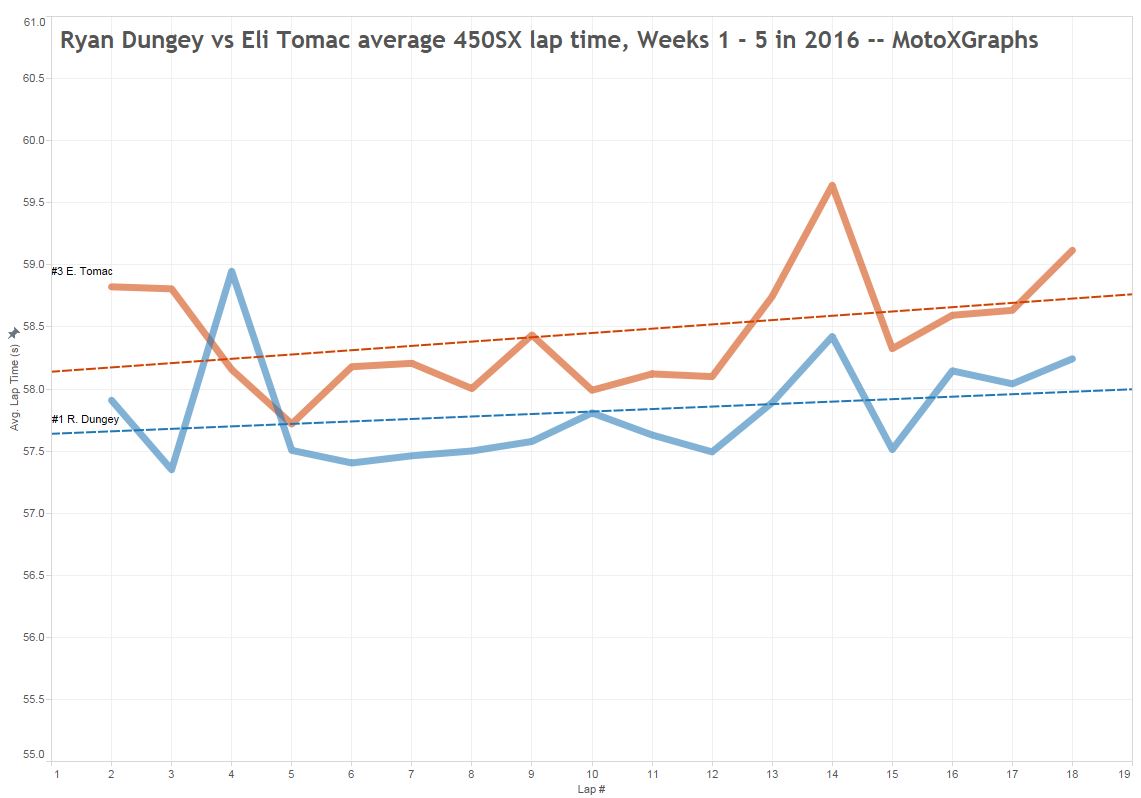
I'm seeing how Tomac's 2nd and 3rd laps are much higher than the others, and wondering if we need to exclude those laps just like 19 and 20, since being stuck in traffic throws in some unexpected noise. I'm reluctant to do that, but just a thought -- add that to the TBD from before, I guess.
But what we see here is that Tomac's average increase per lap is similar to Dungey's overall (0.03 vs Dungey's 0.02 (or 0.05 if you exclude A1)). At Glendale though, Tomac complained of tiring on the back stretch, so what do we see?
Tomac's average increase was 0.175 seconds per lap, which is much higher than what we've seen out of these three riders so far. I would take that to mean that Tomac's fatigue really was more of a factor for him than for the other top riders.
Others Of Interest -- an up-and-comer and a veteran
Jason Anderson has had a penchant in 2016 for starting low in the pack then making a run up toward the front. We can see that in the numbers a little bit, but I think that maybe Anderson starts his run too early in the race, which throws off this model I've created. However, Anderson's increase of 0.010 seconds per lap is below that of Dungey, Roczen, and Tomac over these first 5 races:
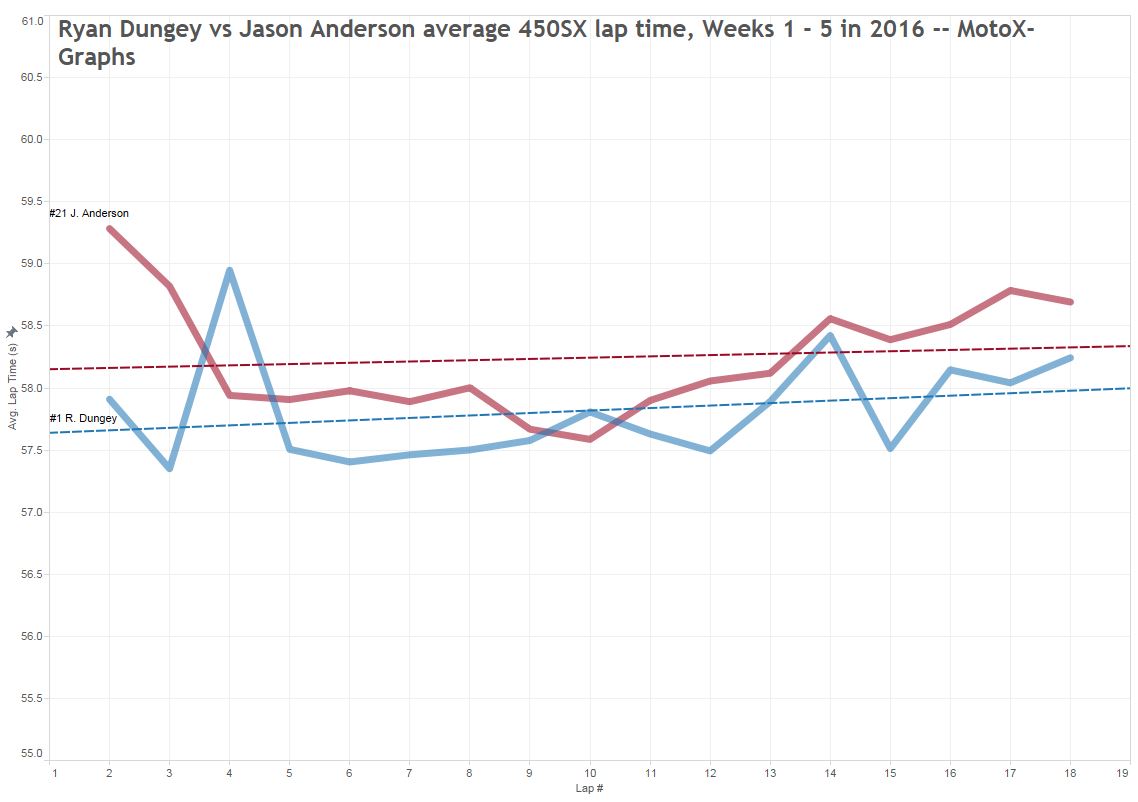
And in the middle, around Lap 10, Anderson has a stretch where he has actually been faster than Dungey -- I can't find any other riders with a section like that. It's interesting that laps 9, 10, & 11 are (on average, of course) faster than his prior laps 4, 5, 6, 7, and 8. That's quite unique and matches what we're seeing from Anderson on the track.
Hmmmm…Chad Reed. He was called "too old", then he raced like he found the fountain of youth, and people stopped questioning him. Well, until this article. My guess would be that an older rider like him should have trouble keeping his quick pace all the way through the race, and would have a tougher time that the younger riders we've covered so far. When we look at Reed's average laps, we see an increase in his lap times that is higher: 0.052 seconds per lap.
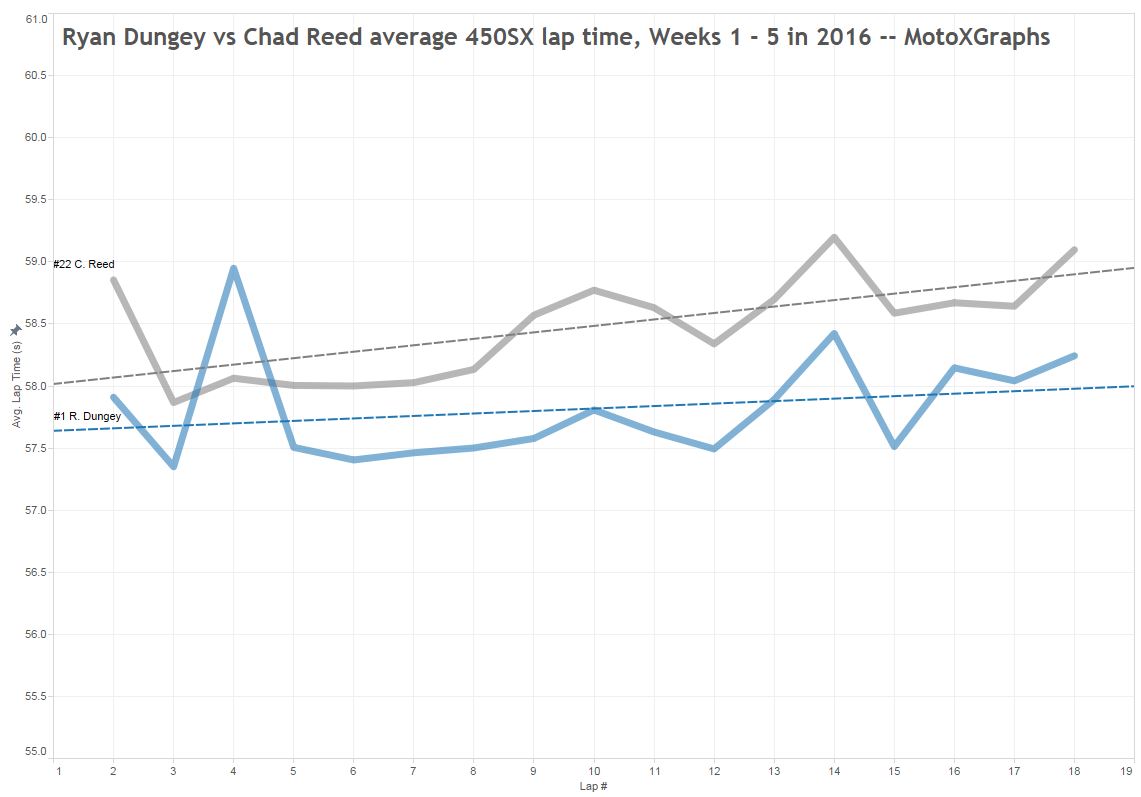
Other than that, his curve pretty closely follows Dungey's. But, Reed hasn't been out in front like Dungey has, where Reed might have an excuse for taking a more conservative approach. That said, Reed's had some pretty comfortable leads in 2nd place, so maybe the difference is more intentional and/or strategic than just Reed getting fatigued.
Wrapping Up
To summarize, it looks like the average rider adds about a tenth of a second per lap as the race goes along, on average. This is likely due to several factors - getting fatigued, deterioration of the course, and from riders racing more conservatively once they establish their position. How much of a factor for any particular cause is difficult to say, but I think we can establish that some of the slowing down is intentional, as it appears for Dungey when we looked at A1 vs SD1 vs A2, etc. One complicating factor is that riders are slowed down at the beginning of the race while they're dealing with traffic, which is not nearly as much of an issue after the first few laps (usually). If a rider slows down by an average of 0.1 seconds per lap, then that slowing would mean that their final lap is 1.9 seconds slower than their first lap (19 laps * 0.1 seconds/lap); cumulatively, that could have an effect of 19 seconds on their entire race time.
Follow up is here, looking at Millsaps, Seely, Mike Alessi, and Pourcel.
Posted by: SagehenMacGyver47 ::: As always – Feedback welcomed
Previous: 2016 Week 5 - By-The-Numbers Recap: Glendale | Back to Blog | Next: How much slowing? -- Follow Up